\( \DeclareMathOperator{\abs}{abs} \newcommand{\ensuremath}[1]{\mbox{$#1$}} \)
| (%i1) | kill(all); |
\[\]\[\tag{%o0} \ensuremath{\mathrm{done}}\]
| (%i1) | load(draw); |
\[\]\[\tag{%o1} "C:/maxima-5.47.0/share/maxima/5.47.0/share/draw/draw.lisp"\]
| (%i10) | ro:1000;g:9.81;h1:2;B:2;R:1;long_x:4; label_left:2.5; label_vert:1.5; label_URL:0.2; |
\[\]\[\tag{%o2} 1000\]
\[\]\[\tag{%o3} 9.81\]
\[\]\[\tag{%o4} 2\]
\[\]\[\tag{%o5} 2\]
\[\]\[\tag{%o6} 1\]
\[\]\[\tag{%o7} 4\]
\[\]\[\tag{%o8} 2.5\]
\[\]\[\tag{%o9} 1.5\]
\[\]\[\tag{%o10} 0.2\]
| (%i11) | H1:R+h1; |
\[\]\[\tag{%o11} 3\]
| (%i12) | x1:R+long_x; |
\[\]\[\tag{%o12} 5\]
| (%i13) | fy(x):=sqrt(R··2−x··2); |
\[\]\[\tag{%o13} \mathop{fy}(x)\mathop{:=}\sqrt{{{R}^{2}}\mathop{-}{{x}^{2}}}\]
P_X
| (%i14) | P_X:integrate(ro·g·(H1−h)·B,h,0,R); |
\[\]\[\tag{%o14} 49050.0\]
| (%i15) | mP_X:integrate(ro·g·(H1−h)·B·h,h,0,R); |
\[\]\[\tag{%o15} 22890.0\]
| (%i17) | h_D_:mP_X/P_X;h_D:H1−h_D_; |
\[\]\[\tag{%o16} 0.4666666666666667\]
\[\]\[\tag{%o17} 2.533333333333333\]
| (%i18) | h_C:H1−R/2,numer; |
\[\]\[\tag{%o18} 2.5\]
| (%i19) | p_C:ro·g·h_C; |
\[\]\[\tag{%o19} 24525.0\]
| (%i20) | w:R·B; |
\[\]\[\tag{%o20} 2\]
| (%i21) | P_X_test:p_C·w; |
\[\]\[\tag{%o21} 49050.0\]
| (%i22) | I_0:(B·R··3)/12,numer; |
\[\]\[\tag{%o22} 0.16666666666666666\]
| (%i23) | h_D:h_C+(I_0)/(h_C·w); |
\[\]\[\tag{%o23} 2.533333333333333\]
| (%i24) | scale_L:P_X; |
\[\]\[\tag{%o24} 49050.0\]
| (%i25) | scale_P_X:P_X/scale_L; |
\[\]\[\tag{%o25} 1.0\]
P_Z
| (%i26) | W1:(R··2−((%pi·R··2)/4))·B,numer; |
\[\]\[\tag{%o26} 0.42920367320510344\]
| (%i27) | W2:h1·R·B; |
\[\]\[\tag{%o27} 4\]
| (%i30) | P_Z1:W1·ro·g;P_Z2:W2·ro·g;P_Z1+P_Z2; |
\[\]\[\tag{%o28} 4210.488034142065\]
\[\]\[\tag{%o29} 39240.0\]
\[\]\[\tag{%o30} 43450.488034142065\]
| (%i31) | W:W1+W2; |
\[\]\[\tag{%o31} 4.429203673205103\]
| (%i32) | P_Z:W·ro·g; |
\[\]\[\tag{%o32} 43450.48803414207\]
| (%i33) | scale_P_Z:P_Z/scale_L; |
\[\]\[\tag{%o33} 0.8858407346410209\]
| (%i35) | fi:atan(P_Z/P_X);fi_gr:fi·(180/%pi),numer; |
\[\]\[\tag{%o34} 0.7249369991568863\]
\[\]\[\tag{%o35} 41.5358304645685\]
| (%i36) | x_z:h_D_/scale_P_Z; |
\[\]\[\tag{%o36} 0.5268065109421495\]
| (%i38) | P:sqrt(P_Z··2+P_X··2);scale_P:P/scale_L; |
\[\]\[\tag{%o37} 65527.455393942495\]
\[\]\[\tag{%o38} 1.335931812312793\]
title = "Сила тиску на криволінійну поверхню",
DRAW
| (%i50) | R;h1;H1;x1;h_D_;x_z;scale_P;scale_P_Z;scale_P_X;P;P_X;P_Z; |
\[\]\[\tag{%o39} 1\]
\[\]\[\tag{%o40} 2\]
\[\]\[\tag{%o41} 3\]
\[\]\[\tag{%o42} 5\]
\[\]\[\tag{%o43} 0.4666666666666667\]
\[\]\[\tag{%o44} 0.5268065109421495\]
\[\]\[\tag{%o45} 1.335931812312793\]
\[\]\[\tag{%o46} 0.8858407346410209\]
\[\]\[\tag{%o47} 1.0\]
\[\]\[\tag{%o48} 65527.455393942495\]
\[\]\[\tag{%o49} 49050.0\]
\[\]\[\tag{%o50} 43450.48803414207\]
| (%i51) |
/* Definition of a block with local variables */ ds(r) := block([x, n], n:100, x:r·n, x:floor(x), x:x/100, return(x) )$ |
| (%i56) | Pi_X:ds(P_X),numer; Pi_Z:ds(P_Z),numer; Pi:ds(P),numer; fi_gr:ds(fi_gr),numer; hi_D_:ds(h_D_),numer; |
\[\]\[\tag{%o52} 49050\]
\[\]\[\tag{%o53} 43450.48\]
\[\]\[\tag{%o54} 65527.45\]
\[\]\[\tag{%o55} 41.53\]
\[\]\[\tag{%o56} 0.46\]
| (%i57) | xi_z:ds(x_z),numer; |
\[\]\[\tag{%o57} 0.52\]
| (%i58) | if h1 < 1 then H2:H1+1 else H2:H1; |
\[\]\[\tag{%o58} 3\]
| (%i59) |
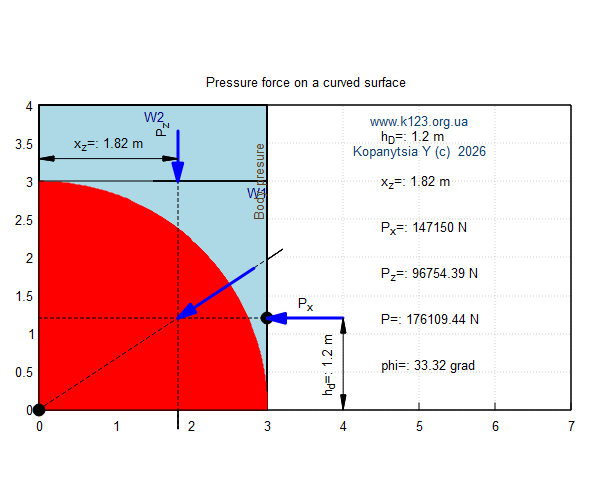
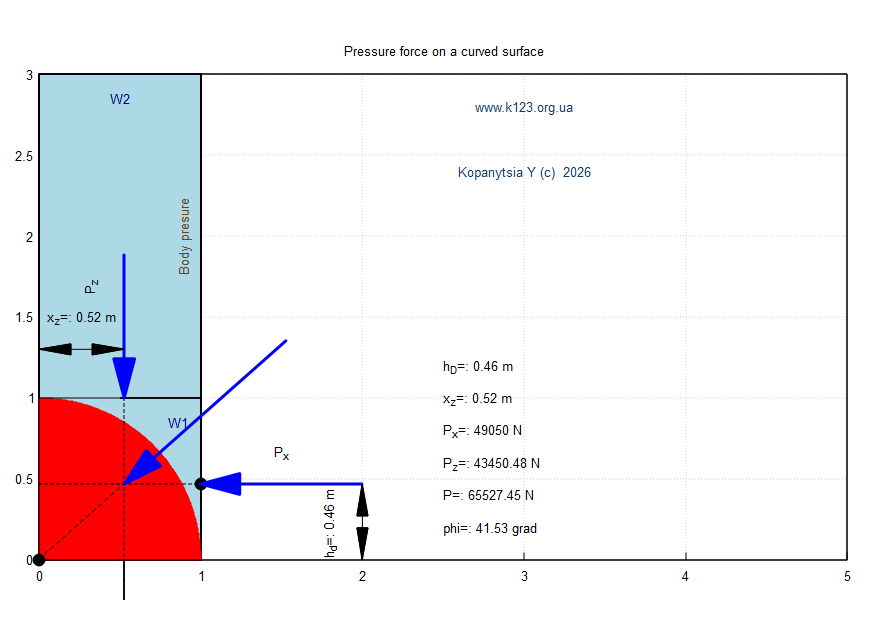
draw2d( xrange = [0,x1], /* size picture x - x1 & y - H1 */ yrange = [0,H2], proportional_axes=xy, font = "Arial", font_size = 16, grid = true, line_width=4,color=black, title = "Pressure force on a curved surface", fill_color = light_blue, line_width=2, polygon([[0,0],[0,H1],[R,H1],[R,0]]), /* rectangle Body of presure */ color=black, fill_color = red, filled_func = true, explicit(fy(x),x,0,R), /* 1/4 circle */ fill_color = light_blue, line_width=1, head_angle = 180, vector([0,R],[R,0]), /* horizontal line between W1 &W2 */ color = navy, label(["W1",R−0.15,R−0.15]), label(["W2",R/2,H1−0.15]), label_orientation = vertical, color = "#654321", label(["Body presure",R−0.1,H1−1]), color = "black", fill_color = light_blue, line_width=2, head_angle = 15, head_length = 0.25, color=black,point_type = filled_circle, point_size = 2, points_joined = false, points([[0,0]]), points([[R,h_D_]]), label_orientation = horizontal, label(["P_x",R+0.5,h_D_+0.2]), label_orientation = vertical, label(["P_z",x_z−0.2,R+0.7]), line_width=1, line_type = dashes, head_angle = 180, vector([0,h_D_],[R,0]), /* horizontal line dot to vector P_x */ vector([x_z,R],[0,−R]), /* vertical line dot to vector P_z */ vector([0,0],[R,scale_P_Z·R]), /* direct angle line dot to vector P */ color = "blue", line_width=3, line_type = solid, head_angle = 15, head_length = 0.25, vector([R+scale_P_X,h_D_],[−scale_P_X,0]), /* horizontal vector P_x */ vector([x_z,R+scale_P_Z],[0,−scale_P_Z]), /* vertical vector P_y */ vector([x_z+scale_P_X,h_D_+scale_P_Z],[−scale_P_X,−scale_P_Z]), /* Full vector P */ font = "Arial", font_size = 16, color = "#0e406e", label_orientation = horizontal, label(["www.k123.org.ua ", x1−long_x/2,H2−label_URL]), label(["Kopanytsia Y (c) 2026", x1−long_x/2,H2−3·label_URL]), label_orientation = horizontal, /* label([string(P_X), x1-0.8, R/2]) */ label_alignment = left, color = black, label([concat("h_D=: ", string(hi_D_)," m"), x1−label_left, R·1.2]), label([concat("x_z=: ", string(xi_z)," m"), x1−label_left, R]), label([concat("P_x=: ", string(Pi_X)," N"), x1−label_left, R·0.8]), label([concat("P_z=: ", string(Pi_Z)," N"), x1−label_left, R·0.6]), label([concat("P=: ", string(Pi)," N"), x1−label_left, R·0.4]), label([concat("phi=: ", string(fi_gr)," grad"), x1−label_left, R·0.2]), line_type = solid, color=black,line_width=1, head_both = true, head_length = 0.2, head_angle = 10, vector([R+scale_P_X,0],[0,h_D_]), /* h_D_ */ vector([0,R+0.3],[x_z,0]), /* x_z */ label_alignment = center, label_orientation = vertical, font_size = 10, label([concat("h_d=: ", string(hi_D_)," m"), R+0.8, h_D_/2]), label_orientation = horizontal, label([concat("x_z=: ", string(xi_z)," m"), x_z/2,R+0.5]) ); |
\[\]\[\tag{%o59} \]
Created with wxMaxima.
The source of this Maxima session can be downloaded here.